
Installing Vertica Management Console
In the previous post in my Vertica series, [[Creating a Vertica Database]], we created the sample VMart database that HP provides. By doing this we were able to do rudimentary tasks using AdminTools. In this post we are going to install Management Console (MC) which is HP's web-based GUI tool. Unlike AdminTools, which runs on the Vertica instance and is invoked via a telnet or ssh session, MC is a web server that can be invoked by any browser with network connectivity to the Vertica cluster.
Unlike SQL Server where the SSMS GUI is not required (all SSMS tasks can be carried out via TSQL commands) there are some tasks that only MC can handle and some that only AdminTools can perform. And then there are some tasks that both tools can handle, but can be done with MC much easier (the Database Designer being one). MC can graphically manage the layout of your schema for you, AdminTools cannot.
In Linux when you REALLY need a GUI admin tool the solution is usually to run a httpd process somewhere that accepts requests from a client web browser and constructs the necessary Linux commands under-the-covers. That's exactly how MC works. Almost anything you do in MC can be scripted to SQL commands and saved for late.
One MC instance can manage many Vertica clusters, each with different security, k-safety etc. Just like SSMS. Your MC version must match your Vertica version however. Your MC users can be different from your database users and you can provide fine-grained permissions to various features in MC. You can install MC before or after you install your first Vertica node. MC will auto-discover your existing db clusters if you install it on an existing cluster node. This is why I've waited until now to cover MC installation.
MC uses ports 22, 5444, and 5450 for cluster communications. 5450 is used for browser communications over https.
Installing MC
- From your laptop (remember, Ubuntu server has no GUI) login to my.vertica.com (accts are free) and download the Vertica console .deb package for your OS and processor architecture (for instance,
vertica-console_7.0.2-1_amd64.deb). - My advice is to install MC on one of the nodes of your cluster. This isn't necessary and in a prod environment may not even be a smart thing to do. So far we have only one node of our development cluster so we will install directly on that. When you do install on a cluster node Vertica will recognize that fact and auto-discover that node and add it to MC automatically.
- I assume you are connecting to your Ubuntu box using PuTTY with SSH. If so you can use pscp to copy your downloaded .deb file to your server. You can google to download pscp if you are running stand-alone PuTTY.
- Open a DOS prompt (elevated) and cd to the location of pscp
pscp <location of .deb file> <user>@<ip>:<path on ubuntu>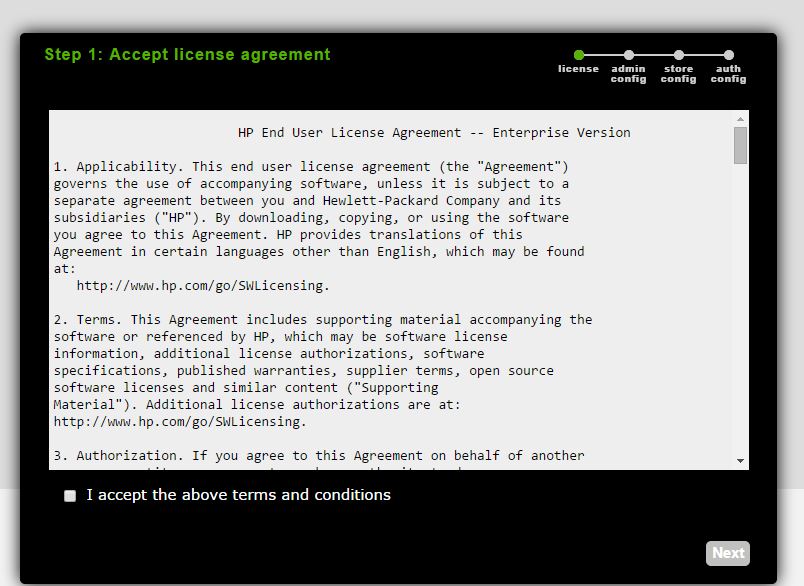 Login to your Ubuntu server as a sudoer (not dbadmin, which is not a superuser)
sudo dpkg -i <pathname>- be patient. This is installing misc java files and any missing dependencies.
- Eventually you will asked to open
https://ip:5450/webuito complete the installation. Leave your terminal/ssh session open, do not close it. - You should first be presented with a license screen in your browser.
- Step 2 you will provide a "superuser" MC user. My advice is to just use the default (see screenshot), which is dbadmin from the underlying Vertica
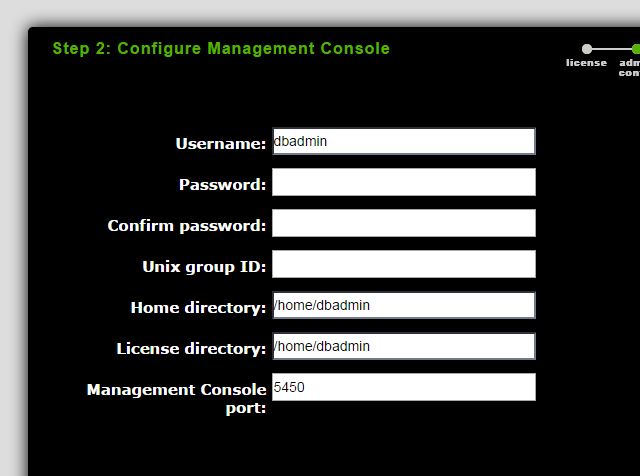 installation on your node.
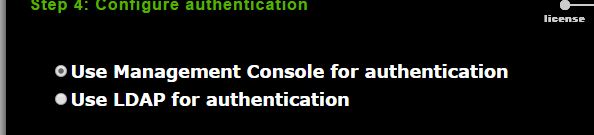
 - You will then pick an authentication mechanism for non-superuser access to MC. I'm not even going to attempt configuring LDAP.
 At this point you likely won't see anything happening in your browser window. Don't refresh or close your browser. If you switch back to your terminal session you can watch config messages scroll through the screen while Vertica builds the MC application given your configuration preferences.
 - Eventually the terminal window will flash a message that the installation is complete and will give you the URL to log in to. At this point you can close the terminal session and the configuration browser window.
- Open the URL and you should see a login screen. Log in with the superuser account that you previously created.
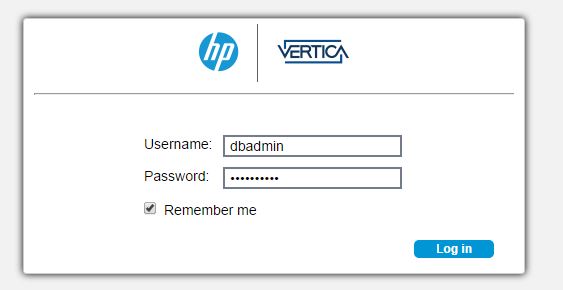
- You should be presented with the following screenshot.

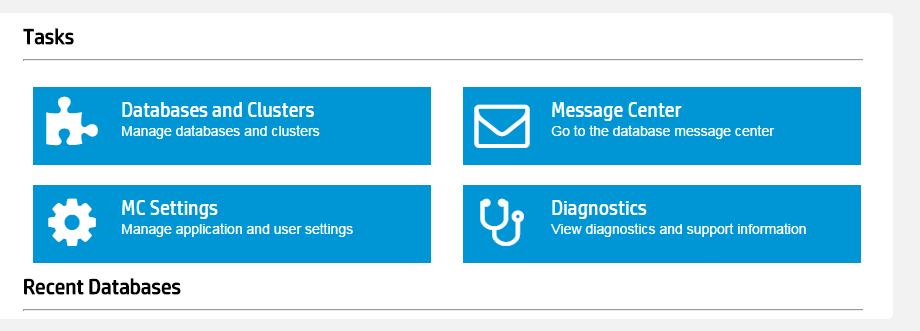
Using Management Console
You can learn a lot about Vertica and MC by just clicking around. "MC Settings" allows you to modify the config values you specified above. This is independent of any clusters you may wish to manage using MC.
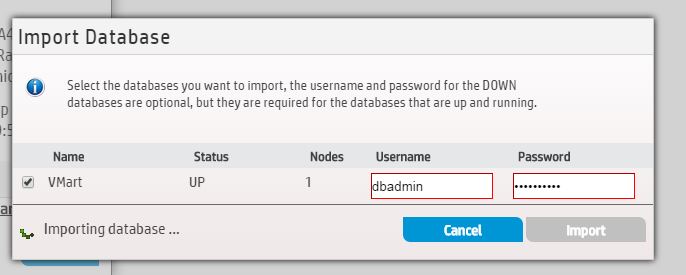
The first task you'll want to do is import your existing (one node) cluster. Click "Database and Clusters" and then Import. Since (if) you installed MC onto an existing cluster node the database will be auto-discovered. You simply have to supply your username/password. If you supply your dbadmin password you will be able to manage all aspects of your cluster. If you only have a limited user account (say, because you only need access to database designer) then add that account here and you will see only limited functionality you have permission to perform.
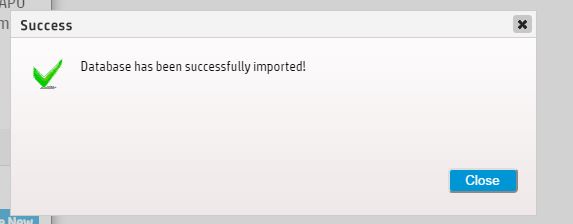
You should receive a success message. You can now discover MC and lots of Vertica features on your own.
I'll point out some interesting MC features that are worth exploring next.
Message Center
The Message Center will display errors (like the Error Log in ssms) as well as alert conditions. Here you can see that my cluster is not k-safe (we'll fix 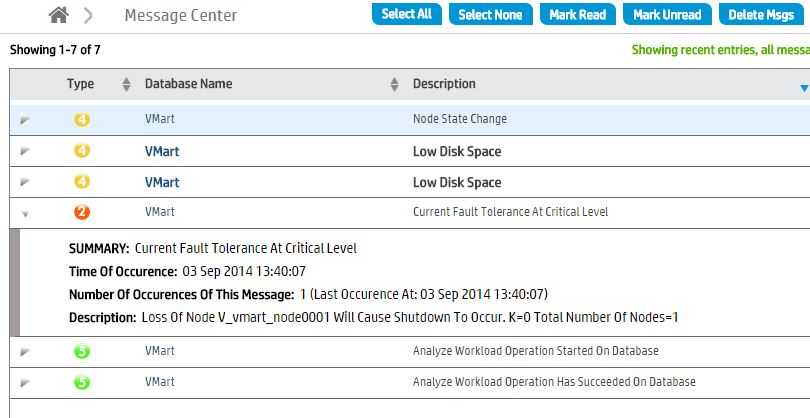
that in a later blog post). One interesting feature is that you have the ability to mark messages as "read", similar to email. You can basically dismiss messages that you don't wish to see again. This cuts down on the noise messages. What is slightly confusing to noobs is how to "expand" a message to read the details. You use the triange to the left of the priority indicator.
Database Overview Page
You access this page by clicking on the "Recent Databases" option for the cluster you just configured.
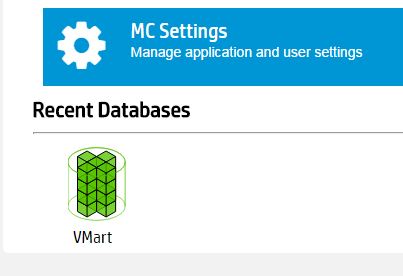
You will be presented with the dashboard/overview page.

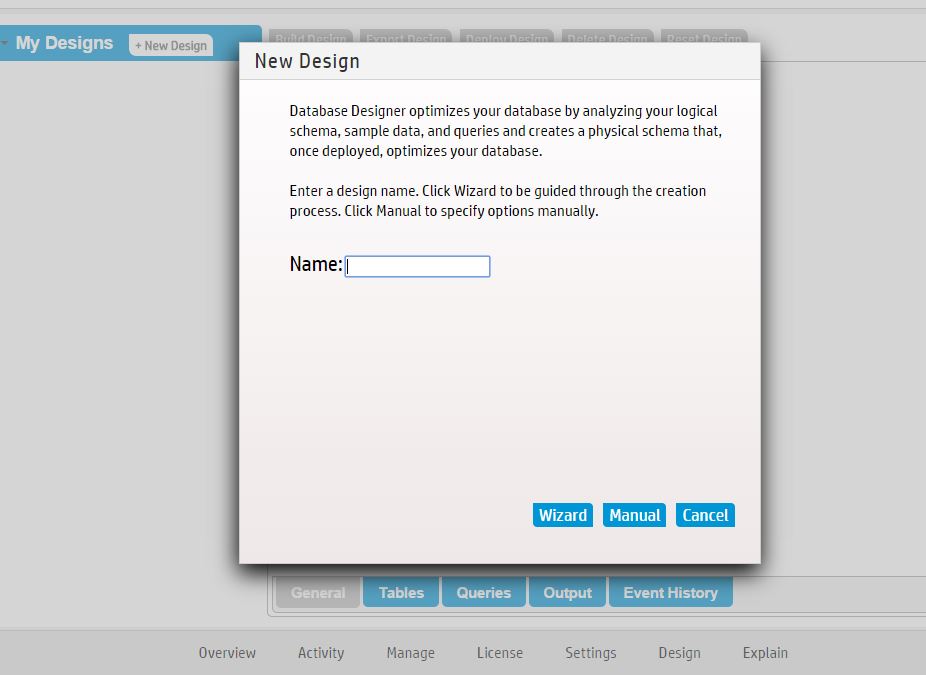
There are tabs along the bottom of the page to access additional functionality. Most interesting is the Design Page which launches the graphical Database Designer wizard. We'll cover this in detail in a future blog post. In a nutshell, this utility let's us tweak our physical designs for performance and k-safety.
Finally, the Explain tab allows you to execute SQL statements and view performance metrics. I quickly typed a simple query and generated an EXPLAIN plan.
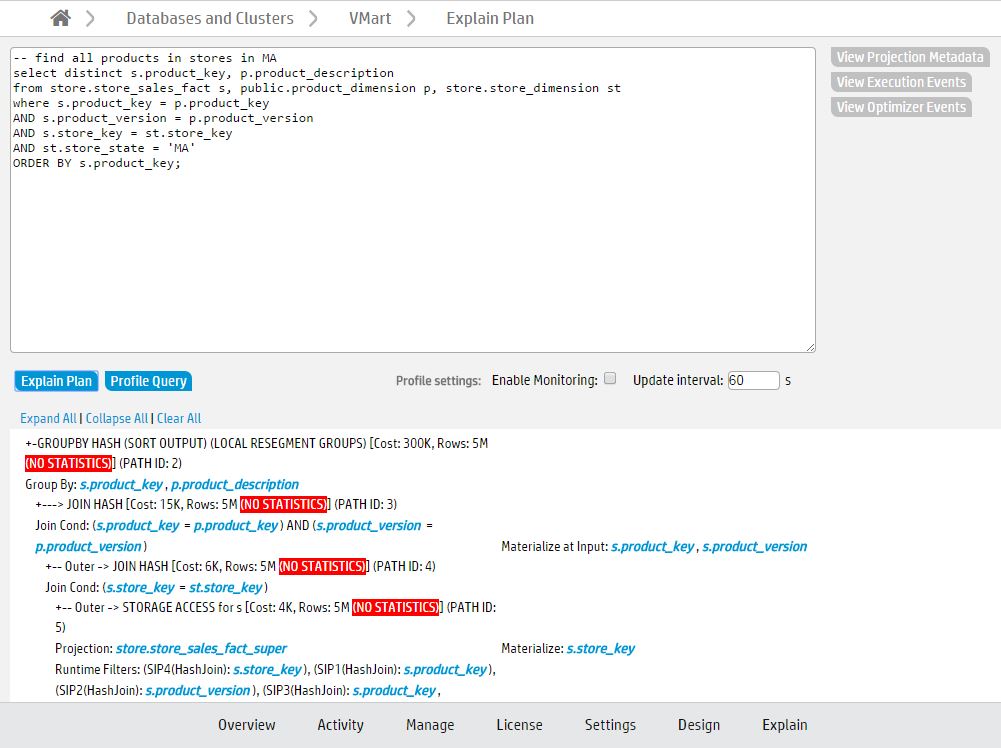
An EXPLAIN plan is equivalent to "Display Estimated Execution Plan" in that the query is not executed but an approximate query plan is returned. The PROFILE option actually executes the query and shows detailed CPU and memory usage.
You can find interesting VMart queries in /opt/vertica/examples/VMart_Schema. Use nano to examine these files or copy them to MC and took at the EXPLAIN plans.
We'll cover some additional management tools in the next post.
You have just read "[[Installing Vertica Management Console]]" on davewentzel.com. If you found this useful please feel free to subscribe to the RSS feed. 
Dave Wentzel CONTENT
vertica